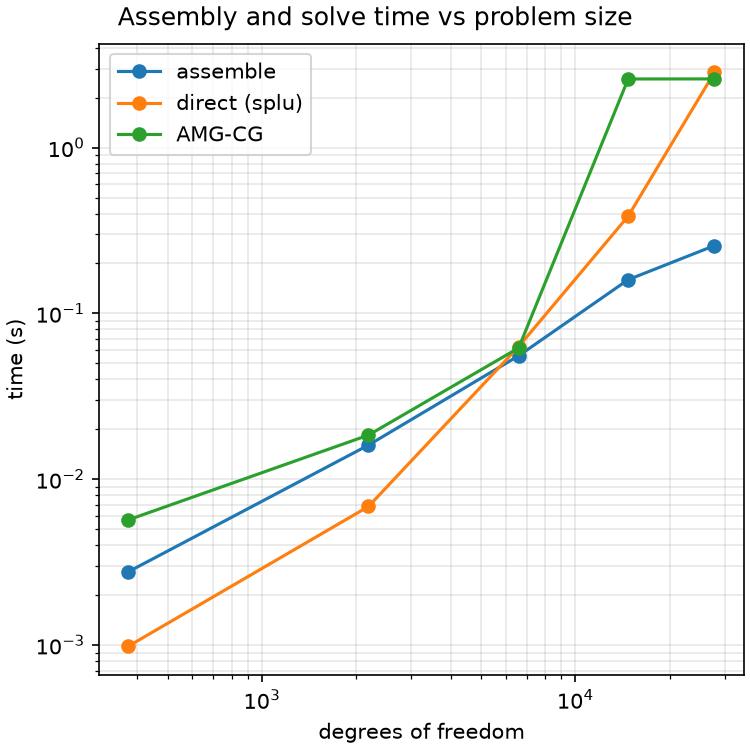
Timing of assembly and both solve backends on a 3D elastic box over a range of sizes.
uv run python examples/cli.py run timing_benchmark
n=  5  tets=     320  dofs=     375  assemble=  0.00s  direct=   0.00s  amg_cg=  0.01s
n=  9  tets=    2560  dofs=    2187  assemble=  0.02s  direct=   0.01s  amg_cg=  0.02s
n= 13  tets=    8640  dofs=    6591  assemble=  0.06s  direct=   0.06s  amg_cg=  0.06s
n= 17  tets=   20480  dofs=   14739  assemble=  0.16s  direct=   0.39s  amg_cg=  2.59s
n= 21  tets=   40000  dofs=   27783  assemble=  0.26s  direct=   2.84s  amg_cg=  2.60s
The functions that pose and solve the problem. The figures are below the fold.
"""Time assembly and the two solve backends versus mesh size, on a 3D elastic box.

Makes the scaling work concrete and guards against regressions: run it before and
after a change to see where the time goes. Sparse matrices moved the cost off the
solve and onto assembly; batching assembly moved it back onto the sparse
factorization, which dominates at any interesting 3D resolution. This benchmark is
what motivated the iterative backend, so it now times both: the direct `splu`
factor+solve against AMG-preconditioned CG. The direct cost grows super-linearly
with fill-in; the AMG-CG cost should overtake it as the mesh grows.

`benchmark` times one box size; `run` sweeps the sizes into a `BenchmarkStudy`.
Nothing here draws: `figures.py` charts the study, and this file is what the gallery
shows. It also runs as a script, printing the table over the default sizes:

    cd examples && uv run python -m demos.timing_benchmark.physics
    uv run python examples/cli.py run timing_benchmark
"""
import contextlib
import logging
import time
from dataclasses import dataclass

from fem.algebra.backends import DirectBackend, IterativeBackend
from fem.algebra.system import DiscreteSystem
from fem.boundary import Dirichlet
from fem.conditions import Conditions
from fem.loads import Source
from fem.mesh.structured import box_mesh
from fem.physics.equations import LinearElastic
from fem.regions import everywhere

DEFAULT_SIZES = (5, 9, 13, 17, 21)


@contextlib.contextmanager
def _quiet_logging():
    """Silence per-solve logging for the duration of a timed section, then restore it.

    Scoped rather than disabled at import: a module-level `logging.disable` would mute
    logging for the whole process the moment this demo is imported, including the CLI's
    own solver-progress output for every other demo.
    """
    previous = logging.root.manager.disable
    logging.disable(logging.CRITICAL)
    try:
        yield
    finally:
        logging.disable(previous)


def _time(fn):
    start = time.perf_counter()
    result = fn()
    return result, time.perf_counter() - start


@dataclass
class Timing:
    """One box size's measurements: kept as numbers, not a formatted string, so the
    figure can chart the scaling trend as well as print it."""
    n: int
    tets: int
    dofs: int
    assemble: float
    direct: float
    amg_cg: float

    def __str__(self) -> str:
        return (f'n={self.n:>3}  tets={self.tets:>8}  dofs={self.dofs:>8}  '
                f'assemble={self.assemble:>6.2f}s  direct={self.direct:>7.2f}s  '
                f'amg_cg={self.amg_cg:>6.2f}s')


def benchmark(n: int) -> Timing:
    with _quiet_logging():
        mesh = box_mesh(corners=[[0, 0, 0], [1, 1, 1]], resolution=(n, n, n))
        bc = Conditions(Dirichlet(everywhere(), [0.0, 0.0, 0.0]))
        equation = LinearElastic(E=200.0, nu=0.3)

        # Building the LinearProblem assembles the stiffness and the load.
        problem, t_assemble = _time(lambda: equation.problem(mesh, bc + Source(lambda p: [1.0, 0.0, 0.0])))
        A, b = problem.tangent(None), problem.load
        partition, values = problem.partition, problem.fixed_values

        # Each backend factors/preconditions in DiscreteSystem's constructor and solves
        # once; timing the whole construct+solve captures the setup each pays.
        _, t_direct = _time(lambda: DiscreteSystem(A, partition, DirectBackend()).solve(b, values))
        _, t_iter = _time(lambda: DiscreteSystem(A, partition, IterativeBackend()).solve(b, values))

    return Timing(n, len(mesh.elements), problem.space.n_dofs, t_assemble, t_direct, t_iter)


@dataclass
class BenchmarkStudy:
    """The timings over the sizes swept, for the chart and the table to read."""
    timings: list[Timing]

    @property
    def dofs(self) -> list[int]:
        return [t.dofs for t in self.timings]

    @property
    def table(self) -> str:
        return '\n'.join(str(t) for t in self.timings)


def run(sizes=DEFAULT_SIZES) -> BenchmarkStudy:
    """Benchmark each box size in `sizes`."""
    return BenchmarkStudy([benchmark(n) for n in sizes])


if __name__ == '__main__':
    print(run().table)
"""The chart and table of the timing benchmark, drawn from a `BenchmarkStudy`."""
from demo_registry import Demo, DemoResult, Figure

from demos.timing_benchmark import physics
from demos.timing_benchmark.physics import DEFAULT_SIZES, BenchmarkStudy, run
from fem.plot.plotter import Plotter


def _scaling_figure(s: BenchmarkStudy) -> Figure:
    plotter = Plotter(title='Assembly and solve time vs problem size')
    ax = plotter.chart_ax(xlabel='degrees of freedom', ylabel='time (s)')
    ax.loglog(s.dofs, [t.assemble for t in s.timings], 'o-', label='assemble')
    ax.loglog(s.dofs, [t.direct for t in s.timings], 'o-', label='direct (splu)')
    ax.loglog(s.dofs, [t.amg_cg for t in s.timings], 'o-', label='AMG-CG')
    ax.grid(True, which='both', alpha=0.3)
    return Figure(
        plotter,
        'Direct factorization grows super-linearly with the fill-in a 3D mesh '
        'brings; AMG-preconditioned CG scales closer to linearly, and overtakes '
        'it as the mesh grows: the crossover this benchmark exists to measure.')


def demo(sizes=DEFAULT_SIZES) -> DemoResult:
    """Timing of assembly and both solve backends on a 3D elastic box over a range of
    sizes."""
    s = run(sizes)
    return DemoResult([_scaling_figure(s)], text=s.table)


# The sweep shows the crossover, so the CLI and the gallery run all five sizes. The
# test only needs to know that assembly and both backends still compose, which n=5
# answers in 0.01s where the full sweep takes 11.6s, over half of it one sparse
# factorisation at n=21.
DEMO = Demo('timing_benchmark', demo, section='Accuracy & performance',
            show_source=physics, smoke_kwargs={'sizes': (5,)})